The Readiness Radar: A One-Stop-Shop for All Who Need Early Childhood Data
By: GEEARS for Saporta Report
We know a lot of data wonks who sit down to a pile of numbers, graphs, charts, and maps, as giddy as a foodie embarking upon a six-course meal.
As for the rest of us, who can think of many things more fun than digging into all that fact- and number-crunching, there is an easier way. You can now find the data you need and make their disparate sources play nicely together.
The Readiness Radar, a decade-old GEEARS tool that we’ve rebooted through a collaboration with Get Georgia Reading, takes care of that problem. Truly a one-stop-shop, the new Readiness Radar pools early childhood data that once existed in several different places and layers them together in a single, easy-to-use online platform. The Readiness Radar houses a range of education, health, housing, economic, and demographic data across the neighborhood, county, and state levels, helping to answer questions related to family and child well-being in Georgia.
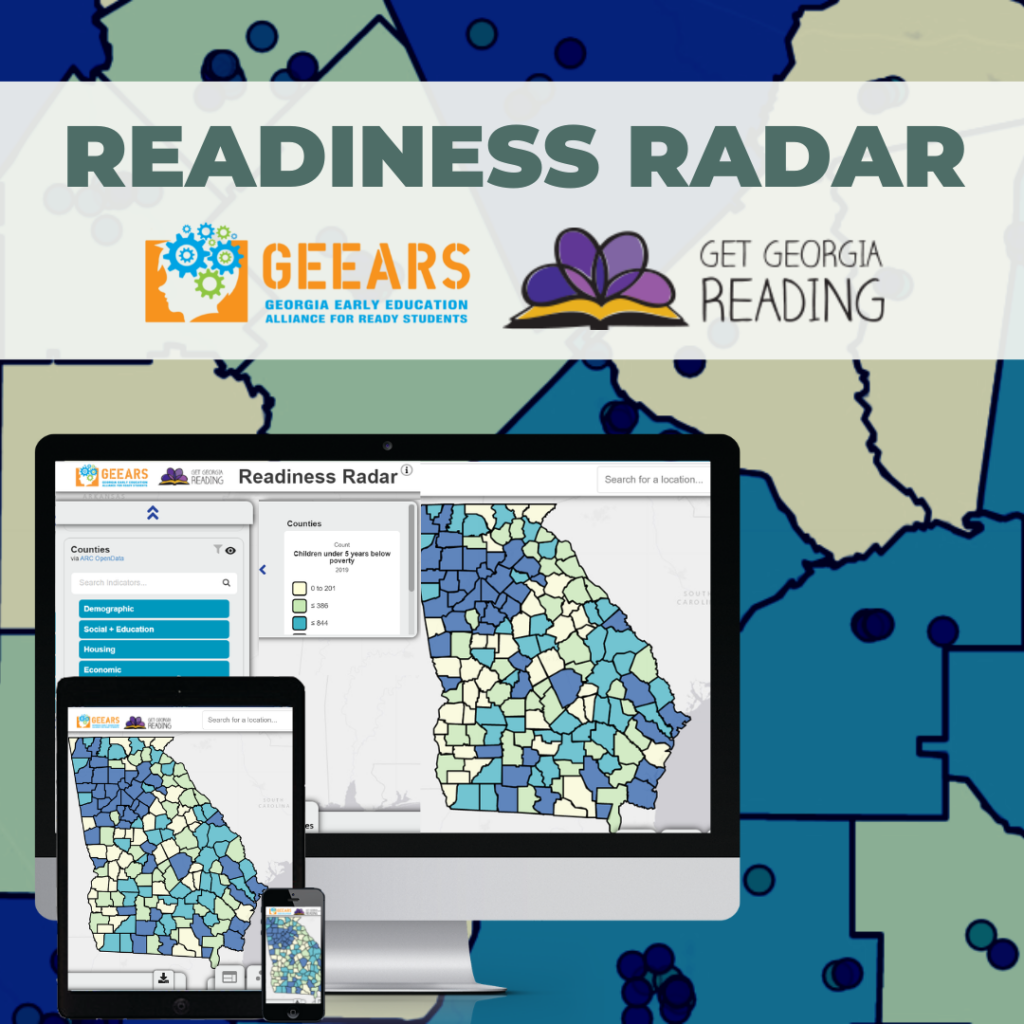
The tool can be used as a simple search engine. If you, say, want to know how many children under 5 live in a particular county, useful in projecting school enrollment numbers, you can find that. If you need to know what percentage of children in a particular geographic area have achieved reading proficiency by third grade—a figure that might be requested by a grant application or overseeing body—you can find that, too.
But the Readiness Radar can also add a wealth of detail and nuance to such data by layering various functions.
Let’s say you’re interested in what child care access looks like in areas with high concentrations of families living in poverty. The Readiness Radar can home in on a specific geographic area and show gaps in access relative to income level.
Show is the operative word here. One of the most exciting features of Readiness Radar is its visual component. The Readiness Radar uses maps with different colors (and even different shades of those colors) to communicate demographic, health, education, housing, and other information at the neighborhood, county, and state levels. Layered upon that map might be color-coded dots that depict points of service such as Quality Rated child care providers, elementary schools, and more.
“The beauty of a mapping tool is you can see data in a different way than you might on a spreadsheet,” notes GEEARS’ Director of Research and Policy, Hanah Goldberg. “The Readiness Radar allows users to see both the demographic landscape of an area and the locations of specific assets, such as early learning programs, in those same areas.”
The list of users who could benefit from such a versatile tool is almost as long as its functions. Goldberg can spontaneously rattle off a number of them.
“School system leaders and non-profit leaders, including funders,” she says. “Policymakers at the local and state levels. Child care providers and prospective child care providers who are interested in opening in an area of need. Journalists who need data to tell their stories. Researchers and higher education leaders. The health community. Basically, anyone who’s trying to better understand and answer questions about a community and what resources exist or might be needed there.”
Such breadth is one of the things that motivated Get Georgia Reading Director Arianne Weldon to partner with GEEARS to refashion the Readiness Radar.
“At Get Georgia Reading, we’ve set out to increase the number of Georgia children reading proficiently by third grade,” Weldon says. “Multiple factors like maternal level of education, preterm birth, and lack of access to quality early care and learning cut off a child’s path to literacy. It’s tremendously helpful to have a data tool that leads us to where all these complex factors intersect so that together we can pave the way to improved outcomes—starting before birth—for every child in Georgia throughout school and life.”
It speaks to Readiness Radar’s range that its most popular features are its “Early Childhood Profiles” and an important feature called the ATL Access Map.
The profiles are simply straightforward. Each one contains key education, health, program enrollment, and other census-collected data for a specific county, city, or legislative district.
The other most-used feature, the ATL ACCESS Map focuses with laser precision on all the overlapping indicators that affect child care supply and demand in five metro Atlanta counties—Clayton, Cobb, DeKalb, Fulton, and Gwinnett. The mapping feature makes it particularly easy to spot child care gaps and where within a community’s demographics they land. While the Readiness Radar is user-friendly to both deep-diving professionals and average Googlers, we do recommend that you learn your way around the tool with this video tutorial from Readiness Radar builder Neighborhood Nexus.
Then let us know how you’re using the Readiness Radar—and how much time it’s saving you!