A Progress Report on How Georgia Supports Its Youngest Children & Their Families
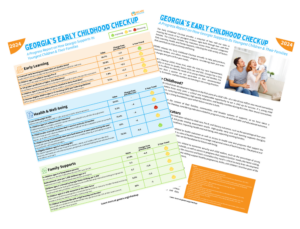
 The Early Childhood Checkup provides a snapshot of how well our state is meeting the needs of our youngest children—ages birth through five—and their families. The Checkup includes key indicators across three general categories: Early Learning, Health, and Family Supports, reflecting the wide variety of factors that contribute to child and family well-being.
GEEARS releases the Early Childhood Checkup annually to help policymakers, community leaders, and others measure progress, considering both year-over-year changes and general five-year trends.
This year’s Checkup (2024) shows that, while the state has seen improvement, most notably in access to Quality Rated child care and WIC, Georgia has a long way to go in its efforts to meet the needs of its young children and families. For example, more than a quarter are not up-to-date on their recommended vaccinations by 35 months–and the numbers are trending in the wrong direction.
Why Early Childhood?
The most active and critical brain development happens in the first years of a child’s life—at a rate of one million new neural connections every second. That makes these early years a critical and irreplaceable opportunity to set a child up for success. If a young child experiences, for instance, nurturing relationships, high-quality education, and healthy nutrition during this time, their neural connections will grow stronger, creating a strong foundation upon which future success is built.
Young children grow up in the context of their families, communities, and broader systems of supports, so we have taken a comprehensive approach to the Check-Up, considering indicators related to program access, as well as health and educational outcomes.
A Guide to the Indicators
The Early Learning category includes indicators related to child care, Pre-K, and literacy outcomes, such as the percentage of four-year-olds enrolled in Georgia’s Pre-K and 3rd grade reading assessment results. High-quality early care and learning supports Georgia’s youngest learners by increasing school readiness, improving health and well-being, and supporting working families.
The Health and Well-being category includes indicators related to health outcomes as well as access to health care and programs that support the healthy development of young children, such as rates of health insurance coverage and pervasiveness of food insecurity. The physical and mental health of young children and their families set the foundation for future well-being.
The Family Supports category includes indicators related to economic security and child welfare, such as the percentage of young children living in poverty and in cost-burdened households, as well as access to programs that support families’ needs, like home visiting. Ensuring families with young children have access to the resources and basic necessities they need is critical to early brain development and overall well-being. Furthermore, programs like home visiting support healthy pregnancies, births, and children’s first few years of life—lowering the risk of adverse experiences, like maltreatment.
Accessing the Checkup
 To access the checkup, you can either download the printable version or explore the new digital version below. The digital version includes:
- Data deep dives and additional resources for select indicators.
- Stories behind the data from different stakeholders who share their experiences related to a specific indicator.
Download a Printable Version of the Checkup
Looking for more information?
The Early Childhood Check-up is meant to be a high-level summary of the state of Georgia’s young children and families. Such a broad view is useful to assess how the state, in general, is performing year-to-year.
We do have a deeper data dive available for those who seek it—our Readiness Radar tool. Please go there to access a wealth of additional information including data for various geographies (e.g., county, Census tract, etc.) and data disaggregated by race and ethnicity.

% Licensed early learning providers that are Quality Rated
Value
65.7%
Percent Change from Last Year
+1.5
Five-Year Trend

% Children age 4 enrolled in Georgia Pre-K
Value
54.3%
Percent Change from Last Year
+7.5
Five-Year Trend

% 3rd graders proficient or higher, ELA Milestones
Value
36.5%
Percent Change from Last Year
+.3
Five-Year Trend

% Children ages 0-2 living below poverty enrolled in Early Head Start
Value
7.9%
Percent Change from Last Year
+2.7
Five-Year Trend

“I just want all children to have access to it.”
An Atlanta child care provider discusses families’ challenging quest for high-quality, affordable care
Read More
% Income-eligible children ages 0-12 receiving CAPS (per Federal guidelines)
Value
5.2%
Percent Change from Last Year
-.2
Five-Year Trend


% Low birthweight births
Value
10.6%
Percent Change from Last Year
—
Five-Year Trend

% Children ages 0-5 without health insurance
Value
5.1%
Percent Change from Last Year
-.4
Five-Year Trend

% Children who received recommended 7-vaccine series by 35 months
Value
72.8%
Percent Change from Last Year
-.5
Five-Year Trend

“The biggest barrier is access.”
A Southeast Georgia pediatrician discusses how to help patients stay monitored, vaccinated, and healthy
Read More
% Children living in households that were food insecure at some point during the year
Value
15%
Percent Change from Last Year
+1
Five-Year Trend

% Eligible children ages 0-4 receiving WIC
Value
76.9%
Percent Change from Last Year
-6.5
Five-Year Trend


% Children ages 0-5 living below poverty
Value
17.9%
Percent Change from Last Year
-4.4
Five-Year Trend

Maltreatment cases per 1,000 children ages 0-4
Value
6.3%
Percent Change from Last Year
—
Five-Year Trend

Children ages 0-2 served by Georgia Home Visiting, per 1,000
Value
9.2%
Percent Change from Last Year
+2.2
Five-Year Trend

“I could trust her.”
An Athens Home Visiting Expert Was Herself a Beneficiary of this Innovative Programming
Read More
% Children ages 0-5 with no parent in the labor force
Value
9.2%
Percent Change from Last Year
+2.2
Five-Year Trend

% Children in households with a high housing cost burden
Value
28%
Percent Change from Last Year
-1
Five-Year Trend


